

The Data Outlet That Called Two US Elections Almost Perfectly — Why Did It Get This One Wrong Too?
The problem underneath: even with the technology we have today, we still know very little about what the public thinks.
The problem underneath: even with the technology we have today, we still know very little about what the public thinks.
Forecasting the US presidential election, once every four years, is probably the most important piece of data analysis in the world.
Over the course of a year, pollsters make millions of phone calls, then read the data and forecast the outcome in different ways. Nothing else draws this many people and this many resources into the work of figuring out what the public is thinking.
Now, a week after the election, the organizations involved are still trying to answer one question — why did they all get it wrong?
The US political news site Mother Jones Photoshopped a picture after the results came in.

The original photo was from the 1948 election. Back then the Chicago Tribune, going on telephone polling, judged that Truman would lose and printed its paper in advance for distribution nationwide. The next day Truman won decisively, and posed for the press holding a copy of the Tribune.
The 1948 forecast was limited by the fact that only a third of Americans owned a telephone, which left pollsters a small pool to sample. That limit is gone today — technology has made nearly everyone reachable by landline or mobile phone, and polling can now also run over the internet, which reaches further still.
With better technology and bigger samples, these forecasts shouldn't have held any "surprises" at all.
You might suspect that outlets like The New York Times and CNN, which lean Democratic, read the numbers with a thumb on the scale. But this time nearly every organization that forecast from polling got it wrong. Even Fox News — one of America's largest television networks and Trump's most important media backer — used polling data to predict that Trump would lose.
The up-and-coming data-analysis outlet FiveThirtyEight guessed wrong too.
The name "538" makes its link to elections easy to guess — that is the number of electors. Each state has a set number of them, and once a state's popular vote is counted, all of that state's electors go to the candidate who finished first.
A US presidential election is a choice between two people, so "guessing" the winner is not especially hard. What made FiveThirtyEight impressive was that, on top of calling the winner of the previous two elections, it got the electoral result right in 49 states in 2008 — and in 2012 it got all 50 states right.
No other organization or outlet could match that. And in 2008, FiveThirtyEight was one person's blog.
But this year FiveThirtyEight — two elections wiser, its team grown to dozens of people — put Hillary Clinton's chance of winning at 71.8%, with 302 electoral votes and a popular-vote split of 48.5% to 45%.
The actual result: Trump took 306 electoral votes to Clinton's 232. Clinton did win more of the popular vote, but by only 0.76 points.
How does FiveThirtyEight make its predictions?
Nate Silver, an analyst who once worked as an economic consultant at KPMG, left the firm in 2004, made $400,000 playing poker, and spent several years as a partner at the baseball site Baseball Prospectus. There he built the PECOTA forecasting system, which rated players' future performance and trade value.
In 2008 Nate Silver founded FiveThirtyEight to forecast the election.
Because it called the 2008 electoral votes accurately, FiveThirtyEight drew attention fast. By the day Obama was elected, the site was getting close to 5 million visits a day. The New York Times, then a top-ten US website by traffic, was getting only about 20 million a day.
In June 2010 The New York Times bought FiveThirtyEight and folded it in as a sub-brand of the paper's group of more than a hundred blogs.
In 2013 Nate Silver left The New York Times for ESPN, the Disney-owned sports news network. The independent site fivethirtyeight.com launched at the same time, with a fox for a logo.
The philosopher Isaiah Berlin wrote in The Hedgehog and the Fox that the fox knows many things and the hedgehog knows one big thing. The hedgehog fits the whole world under a single idea; the fox accepts a spread of experience that will not reduce to one, and refuses to settle on a single view.
Nate Silver casts himself as the fox, and traditional media as the hedgehog. Those outlets, he argues, call the race by their own strong partisan instincts, while the fox trusts what it sees from many angles and keeps revising, to arrive at a more accurate call.
When Nate Silver describes how he decides, he points to Bayesian decision theory in mathematical statistics. That is: when information is incomplete, you estimate the partly unknown states with subjective probabilities, revise those probabilities with Bayes' formula, and then pick the best option using expected values and the revised probabilities.
From its first election forecasts to its later work rating baseball players, FiveThirtyEight has never had data of its own. It analyzes outside data; what sets it apart is its forecasting model.
FiveThirtyEight has three forecasting models:
- Polls-plus: A forecast that combines polling numbers with economic indicators. The model assumes the race will be fairly close.
- Polls-only: A simpler, what-you-see-is-what-you-get forecast. It counts polling results alone, reflects the odds of winning on election day itself, and carries more uncertainty than Polls-plus.
- Now-cast: Uses current polling to forecast the odds of winning if the election were held today — far more aggressive than the other two.
What separates the models is how they combine the various polls, giving each a different weight before arriving at a forecast.
Building your own forecast on outside data is standard practice among other forecasters as well. The New York Times's Upshot uses The Huffington Post's polling database; The Economist works with YouGov; NBC News works with the online research firm SurveyMonkey.
Overall polling was off by less than 4 points
The opinion polls we run into day to day can come from all sorts of institutions, organizations, or individuals — newspapers and magazines, television, the internet, consulting firms. The votes run by QDaily Research Lab are a form of opinion polling too.
US presidential election polling is mostly run by media outlets on their own or in partnership with polling firms.
They use random sampling to pick a group of registered voters and ask how they plan to vote. Once the data is in, pollsters usually weight it according to how the sample breaks down.
Gallup and other pollsters that do this well tally the quantitative results across the whole sample, compare them with national data, and find which groups are over- or under-represented among respondents. In later surveys they then adjust who they interview — deliberately, not randomly — to offset the imbalance before producing a final result.
Today's polling methods were worked out after a failed forecast in the 1936 election.
In 1936 the Democratic candidate, Franklin Roosevelt, was seeking reelection; his opponent was the governor of Kansas, Alf Landon, of the Democratic Party. Literary Digest, a well-known magazine at the time, mailed 10 million postcards for its poll, using phone-book listings, magazine subscription lists, and the membership rosters of assorted clubs and organizations. It got 2.4 million replies.
From that data it concluded that Landon would beat Roosevelt 57 to 43 in vote share, and take 307 of the 531 electoral votes then in play.
The count came back the other way: Roosevelt won 62% of the vote and crushed Landon 523 to 8 in the electoral college, winning another term.
The trouble with Literary Digest's poll was that the people it picked did not stand in for the whole country — nobody on those lists was working class.
Gallup, still a major force in polling today, used random sampling in 1936 — a smaller sample, but spread across more ethnic groups and more social classes — to predict Roosevelt's win correctly, and made its name in one stroke.
Today, with better technology, the number of people a poll can reach is no longer a problem, and there is no longer a large class of people without a phone.
In fact, the polling numbers were not off by much.
Overall polling in the week before this election had Clinton ahead by 4 points; the actual result had her ahead by 0.6. A gap of under 4 points is a reasonable range.
Polling was further off on where the swing states' electoral votes would go. A state is generally called a swing state when one candidate's lead in support is under 6 points.
Plenty of pre-election analysis and polling suggested Clinton would have no trouble locking down the Democrats' reliable 242 electoral votes; add the swing state of Florida's 29, and she would pass the 270 the law requires to win the presidency.
For Trump to win, he had to hold the Republican base and take as many swing-state electoral votes as he could, since he had almost no chance in Democratic-leaning California and its 55 votes.
The five most important swing states — Florida, Michigan, New Hampshire, North Carolina, and Pennsylvania — held 84 electoral votes between them.
By FiveThirtyEight's post-election count, those were exactly the states where polling was furthest off. In Utah, Ohio, Wisconsin, and Iowa, Trump's margin ran far ahead of the polling average, by more than 6 points.
Nearly every analysis outfit, reading the polls, predicted Trump could not take these states. He took four of the five key swing states, losing only New Hampshire and its 4 electoral votes.
One plausible explanation is that many Trump supporters would not say what they really thought when a pollster called. They may have said publicly that they backed Clinton, and voted for Trump in the end.
The Pew Research Center calls these voters "shy Trump supporters."
Anti-Trump media and celebrities were bound to skew the polls
Peter Thiel, the well-known Silicon Valley venture capitalist, said in a speech endorsing Trump at the National Press Club in Washington earlier this month: "I don't agree with everything Trump says on every occasion either. But the media never studied Trump seriously — they only seized on his words. Trump's voters did the opposite."
Trump's campaign slogan was Make America Great Again. He promised jobs, a safer country, and a cleanup of corruption in Washington — a message that, in a sluggish economy with frequent mass shootings, met the public's discontent precisely where it was.
But the things Trump said day to day were deeply off-putting. He tweeted a set of statistics on shootings by Black people, for instance, and the numbers were wildly wrong.
Even Fox News, which backed him hard, said on air that this was not acceptable. Here is the exchange, word for word:
Bill O'Reilly: You tweeted a set of murder statistics you'd seen somewhere else — that 81% of white people murdered in 2015 were killed by Black people. That's completely wrong. In fact only 15% of white victims were killed by Black people. Trump: Hey, Bill, Bill — I see hundreds of thousands, millions of numbers online. Am I supposed to check every one? Bill O'Reilly: You have to. You're running for president.
That was one example among many: there were also his absurd remarks about using nuclear weapons and his talk of killing terrorists' families, which would break international law. The media and outspoken celebrities watched these remarks closely, trying to convince the public that voting for this man was as absurd as it gets.
Chris Wallace, the Fox News host, said that after the Republican convention many news organizations agreed, as one, that Trump had crossed a line — and decided they no longer had to follow the ordinary rules of the trade, or be objective.
Once the tape of Trump insulting women came out, the voices against him grew louder. As the coverage piled up, dozens of Republican senators and representatives announced they would no longer back Trump. South Park, in episode 5 of this season, mocked the moment outright: "I've said so much crazy stuff about killing people, about Muslims and Mexicans, and now this is what finally gets to you?"
This man said many indecent things, but he did represent one class's anger at the way things are. Plenty of voters disliked some of what he said, and still wanted someone to break the status quo more — just as Peter Thiel put it.
Here is a concrete example. In late August FiveThirtyEight compared two sets of polling data, one from live interviews, the other from interviews without a live interviewer. The model built on live-interview polling put Clinton's chance of winning as high as 86%; the non-live data put it at 70.5%.
Other research has found the same thing: calls made with a recorded voice returned far higher support for Trump than calls made by a person.
In the end it comes down to how you read the numbers
The polling in key states was off, but right up until the swing states began counting, the polls still showed the popular-vote gap between Trump and Clinton as small — which suggested two unpopular candidates could pull roughly the same number of supporters.
Another sign: a large share of people held off deciding. When the last round of national polling closed, 12.5% of voters still had not made up their minds. In each of the previous three elections that figure was under 4%.
The signs point to a race that was genuinely unsettled. The Trump tape, and the FBI's reopening of the Clinton email affair shortly before the vote, both made the outcome hard to predict.
So why, reading all of this, did the various outlets and forecasters still arrive at the answers they did?
One objective reason is that the numbers that finally reached the public were too simple. A typical forecast piece runs under a thousand words, with a few charts and some analysis. FiveThirtyEight itself published pieces warning that this would be a tight race.
But what people outside actually saw was not those long paragraphs and complicated tables. Most saw one line on a social network, a figure quoted on a live broadcast, or the big number at the top of a forecast page. Each of them was a single number.
These organizations spent enormous amounts of time analyzing tens of millions of numbers, and the only thing the public ended up caring about was one of them. A single number cannot show how complicated an election is. Given how the election itself works, that number also read more like a support rate — which made it misleading.
Subjectively, the people doing the reading mostly disliked Trump. They were not trying to mislead readers; not every American turns out to vote, and badly underestimating Trump would, if anything, have helped his odds. But the information these people took in from the media, and the commentary they saw from professionals in every field, opposed Trump as much as they did.
What a person believes shapes the reading they can build, especially when the margin is thin.
After the election, Dean Baquet, executive editor of The New York Times, said: "We've got to spend more time on the road, go to more places, talk to the people you don't normally talk to. If your newsroom happens to be in New York, you have to remind yourself that New York is not the real world." (Trump took only about 30% of the vote in New York.)
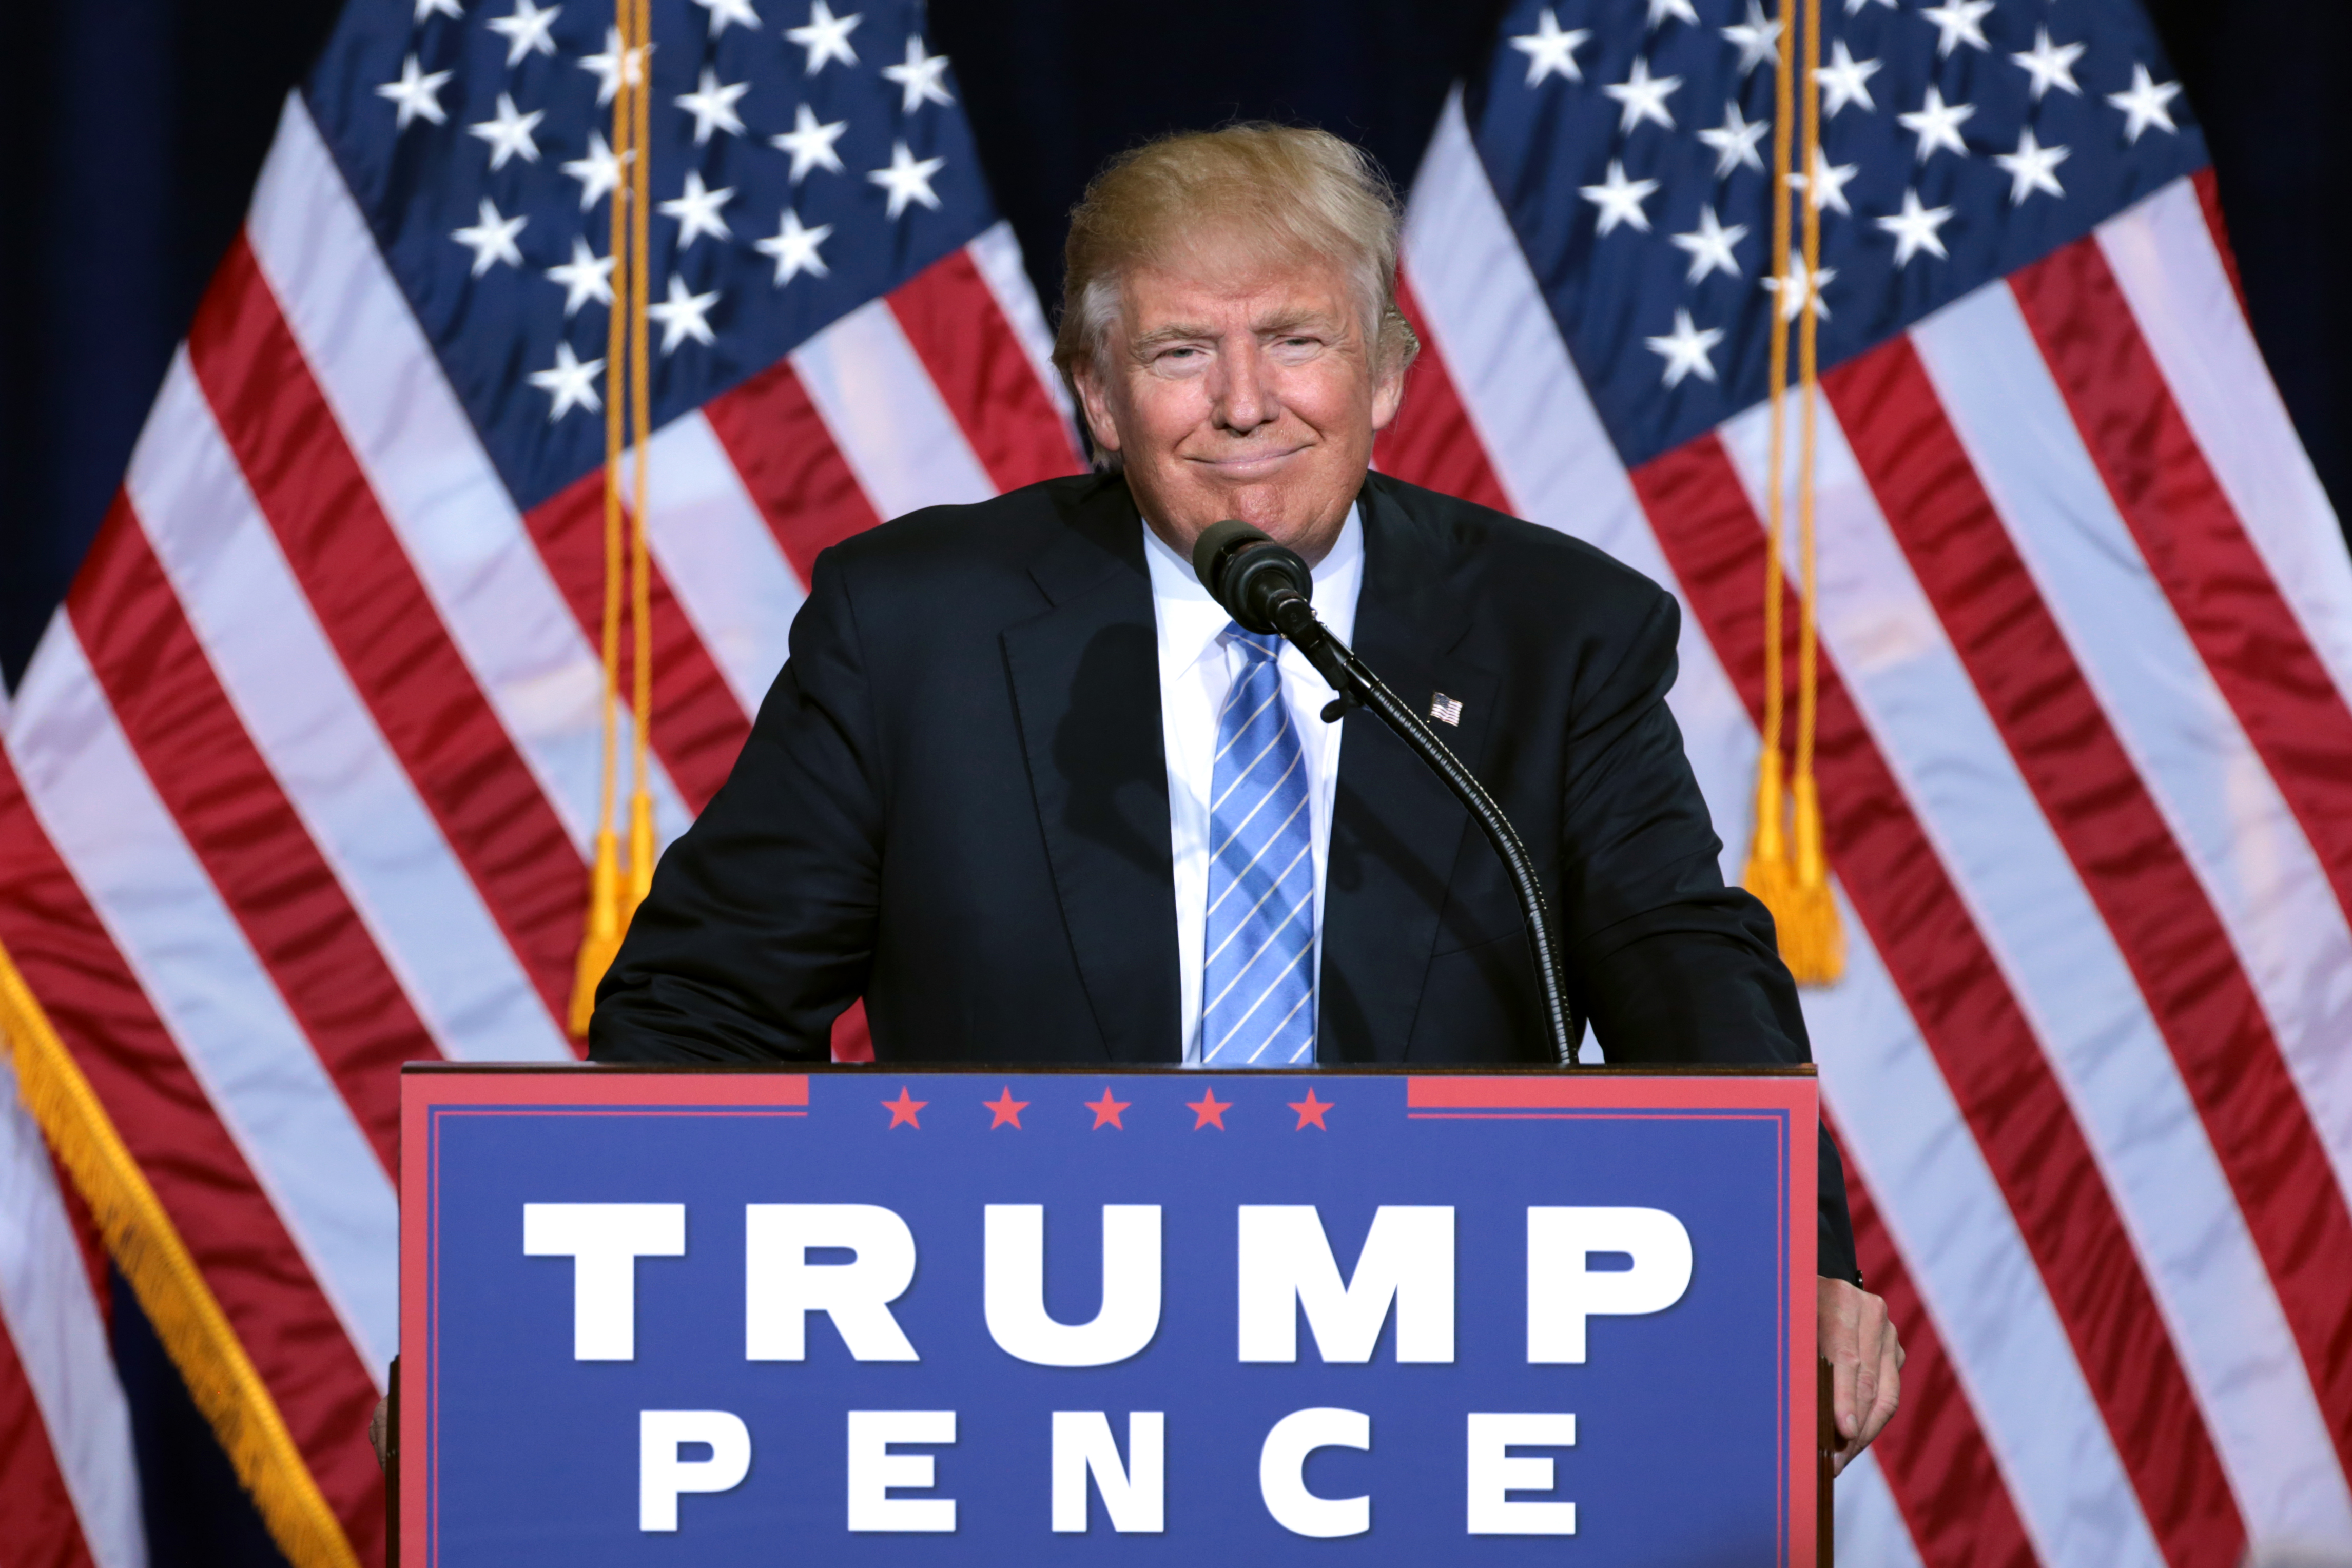
Cover image sources: wikimedia1, wikimedia2, wikimedia3
.jpg)

Translated from the original QDaily article. Original publication date retained.